
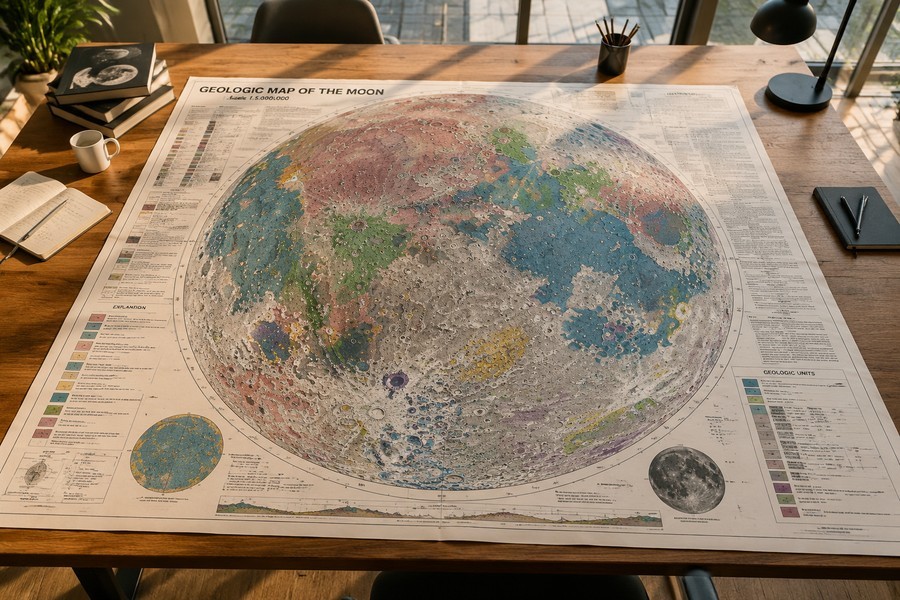
A Highly Detailed New Chart of the Moon
Scientists have successfully created a highly detailed new map of the moon. This map updates previous versions with the latest scientific discoveries. By looking closely at the lunar surface, researchers have adjusted what we know about the moon's oldest time periods. This new chart is designed at a scale of one to five million, offering a clear and organized view of the moon's geological past.
The updated map helps clarify how the moon changed over billions of years. It reorganizes the timeline of the moon's history, making our understanding of its development much more precise. The creators of the map focused on making the timeline of the moon's history more systematic, allowing researchers around the world to use a shared, refined system for studying lunar geology.
Redefining the Moon's Ancient Eras
The new map divides the moon's history into specific time periods. It sets new boundaries for three major ancient eras on the moon. These eras help scientists understand the sequence of events that shaped the lunar surface:
- The Aitkenian period: This is an ancient era that some scientists call the pre-Nectarian period. It covers the earliest time in the moon's history, from about 4.5 billion years ago to 3.9 billion years ago.
- The Nectarian period: A middle era of ancient lunar history marked by major impacts and changes on the surface.
- The Imbrian period: Another key phase in the moon's early geological development that followed the Nectarian era.
Mapping Rare Materials on the Lunar Surface
The creators of the map used advanced data to trace unique materials on the moon's crust. Specifically, they mapped an area known as the KREEP terrane. This region contains rocks that are rich in three specific elements:
- Potassium: A chemical element represented by the symbol K.
- Rare-earth elements: A group of heavy metals that are highly valued for their unique properties.
- Phosphorus: A key element represented by the symbol P.
How Space Missions Helped Build the Map
To build such a detailed map, scientists relied on decades of space exploration. Years ago, space missions from both the United States and the Soviet Union brought the very first moon rocks back to Earth. These early samples helped scientists understand the basic chemical makeup of the moon.
More recently, robotic missions have gathered even more samples. One of these recent robotic missions was especially important because it landed on the far side of the moon. This is the hemisphere of the moon that always faces away from Earth, making it difficult to study. The materials collected from this hidden side have given researchers a brand new starting point for studying how the entire moon was formed, as the far side has different features than the side we see every night.
A New Standard for Mapping Other Worlds
This map does more than just show the moon. It also introduces a new system for how space maps are designed. The creators developed a specific visual style to make the map easier to read. For example, they used an aesthetic rule where lighter colors represent younger geological areas, while darker colors represent older areas.
This design system is expected to be used for future projects. As scientists continue to explore outer space, they plan to apply these same mapping rules to other planets and moons in our solar system. This creates a consistent way for researchers to study and compare different worlds, establishing a new framework for deep space exploration maps in the future.